Market Outlook
December 19, 2016
Market Cues
Domestic Indices
Chg (%)
(Pts)
(Close)
Indian markets are expected to open flat tracking the SGX Nifty.
BSE Sensex
(0.1)
(30)
26,490
Nifty
(0.2)
(14)
8,139
US Markets closed flat on Friday after selling pressure removed the early gains in the
session. This selloff has been attributed to news that the Chinese Navy seized an
Mid Cap
(0.0)
(4)
12,237
underwater drone belonging to a U.S. oceanographic vessel in the South China Sea.
Small Cap
(0.2)
(30)
12,114
the Commerce Department released a report showing a steep drop in new
Bankex
(0.5)
(115)
20,984
residential construction in the month of November. The Commerce Department
released a report showing a steep drop of 18.7 percent in new residential
Global Indices
Chg (%)
(Pts)
(Close)
construction to an annual rate of 1.09 mln in November against an expectation of
1.23 mln.
Dow Jones
(0.0)
(9)
19,843
Nasdaq
(0.4)
(20)
5,437
The European markets continued their gains in Friday's session with pharma stocks
leading the rally. Pharma stocks such as Shire, Hikma Pharmaceuticals and Actelion
FTSE
0.2
13
7,012
were up by 1.60, 2.75 and 10.48 percent repectively. Mining stocks fell due to
Nikkei
0.7
127
19,401
weakness in commodity prices. Miners BHP Billiton and Anglo American PLC fell by
Hang Seng
(0.2)
(39)
22,021
0.53 and 1.9 percent respectively.
Shanghai Com
0.2
5
3,123
Indian markets fell for the third straight session on Friday as FII continued to
withdraw funds after the US Federal Reserve’s decision to raise interest rates. Most
Advances / Declines
BSE
NSE
sectoral indices closed in the red with the Metal index being the worst performing
Advances
1,123
597
index. The metal index closed down by 1.55 percent, followed by the FMCG index
which closed down 0.76 percent for Friday’s session. Among the winners, the Auto
Declines
1,505
992
index reported a mild gain of 0.3 percent.
Unchanged
165
82
News Analysis
Volumes (` Cr)
Steel companies plan big price hike in January
BSE
3,140
NMDC invests `1,222cr to set up Nagarnar steel plant
NSE
18,134
Detailed analysis on Pg2
Investor’s Ready Reckoner
Net Inflows (` Cr)
Net
Mtd
Ytd
Key Domestic & Global Indicators
FII
(406)
(782)
26,496
Stock Watch: Latest investment recommendations on 150+ stocks
MFs
(62)
(154)
38,032
Refer Pg5 onwards
Top Gainers
Price (`)
Chg (%)
Top Picks
CMP
Target
Upside
Oberoirlty
329
5.6
Company
Sector
Rating
(`)
(`)
(%)
Biocon
978
4.7
Amara Raja Batt. Auto & Auto Ancill.
Buy
903
1,167
29.3
J&Kbank
64
4.5
Alkem Laboratories Pharmaceuticals
Buy
1,602
1,989
24.2
HCL Tech
IT
Buy
821
1,000
21.9
Redington
97
4.4
Power Grid Corp. Power
Buy
184
223
21.1
Ucobank
35
4.3
Navkar Corp.
Others
Buy
174
265
52.1
More Top Picks on Pg3
Top Losers
Price (`)
Chg (%)
Key Upcoming Events
Jppower
4
(5.9)
Previous
Consensus
Date
Region
Event Description
Edelweiss
83
(5.4)
Reading
Expectations
Dec 21 Euro Zone Euro-Zone Consumer Confidence
(6.1)
(6.0)
Intellect
155
(4.5)
Dec 21 US
Existing home sales
5.6
5.5
Havells
323
(4.1)
Dec 22 US
GDP QoQ (Annualised)
3.2
3.3
Shreecem
14,093
(4.1)
Dec 22 US
Initial Jobless claims
254.0
258.5
As on December 16, 2016
Dec 23 UK
GDP (YoY)
2.3
2.3
More Events on Pg4
Market Outlook
December 19, 2016
News Analysis
Steel companies plan big price hike in January
Major domestic steel companies plan to raise prices by about ` 6,000 per tonne
from the month of January. This is due to an unprecedented rise in coking coal
rates and weak retail sales, which are reducing margins. Coking coal prices have
gone from `7,000 to `22,000 per tonne over the past few months. Retail sales
have seen a drop of as much as 20% due to the impact of demonetisation.
As on December9, the price of domestically produced hot-rolled coil stood at
`36,750 a tonne. A `6,000 hike in product prices would be the biggest increase
by steel producers since the government started taking measures to curb cheap
imports in October 2015.
Sajjan Jindal-led JSW Steel, Essar Steel, Tata Steel, and Naveen Jindal-led Jindal
Steel & Power, among others, are the major steel producing companies in the
domestic market.
NMDC invests `1,222cr to set up Nagarnar steel plant
NMDC has invested `1,222cr to set up a 3 million tonnes per annum (MTPA)
integrated steel plant in Nagarnar in Bastar district of Chhattisgarh.
The plant is expected to start trial production by mid-2017.
The company has completed capital expenditure of `1,434.55cr till September
2016, of which `1,222.65cr has been invested in Nagarnar steel plant, the
company stated in a corporate presentation.
Economic and Political News
India attains 4th position globally for installed wind power capacity
115 cities launch water supply and sewerage projects under Atal Mission at a
cost of `6,346cr
Polymer prices likely to rise by 10 percent, due to sharp rise in crude oil prices
Centre working on plan to raise milk production to 242 mln tonnes from
155 mln tonnes over next few years
Corporate News
NTPC and NALCO signs MoU to establish a 2400 MW Coal based power
project at Gajmara, Odisha
Max Life and HDFC Life tol submit new revised structure of merger deal
Indian Hotels Co Ltd (IHCL), Tata Steel, Tata Motors and Tata Chemicals to
vote on Mistry's removal as director this week
ONGC Videsh raises $1bln to finance its acquisition of 15 percent stake in
Vankor
Market Outlook
December 19, 2016
Top Picks ★★★★★
Large Cap
Market Cap
CMP
Target
Upside
Company
Rationale
(` Cr)
(`)
(`)
(%)
To outpace battery industry growth due to better
Amara Raja Batteries
15,419
903
1,167
29.3
technological products leading to market share gains in
both the automotive OEM and replacement segments.
Strong growth in domestic business due to its leadership in
Alkem Laboratories
19,154
1,602
1,989
24.2
acute therapeutic segment. Alkem expects to launch more
products in USA, which bodes for its international business.
The stock is trading at attractive valuations and is factoring
HCL Tech
1,15,790
821
1,000
21.9
all the bad news.
Back on the growth trend; expect a long term growth of 14%
Infosys
2,30,659
1,004
1,249
24.3
to be a US$20bn in FY2020.
Strong order backlog and improvement in execution would
Larsen & Tourbo
1,26,741
1,359
1,634
20.2
trigger the growth for the L&T
One of the largest pharma companies with strong
international presence. It has a rich pipeline of ANDAs
Lupin
66,281
1,469
1,809
23.2
which is also one of the largest among the generic
companies.
Going forward, we expect the company to report strong
Power Grid Corporation
96,340
184
223
21.1
top-line CAGR of ~16% and bottom-line CAGR of ~19%
over FY16-18 on back of strong capitalization guidance
Source: Company, Angel Research
Mid Cap
Market Cap
CMP
Target
Upside
Company
Rationale
(` Cr)
(`)
(`)
(%)
We expect the company would report strong profitability
Asian Granito
654
218
351
61.4
owing to better product mix, higher B2C sales and
amalgamation synergy.
Among the top 4 players in the consumer durables segment.
Bajaj Electricals
2,213
219
274
25.1
Improved profitability backed by turn around in E&P
segment. Strong order book lends earnings visibility.
Favourable outlook for AC industry augurs well for Cooling
Blue Star
4,505
472
634
34.4
products business which is outgrowing the market. EMPPAC
division's is likely to turn around on improving economy
With a focus on the low and medium income (LMI)
Dewan Housing Finance
7,565
242
350
44.9
consumer segment, the company has increased its presence
in tier-II & III cities where the growth opportunity is immense.
Strong loan growth backed by diversified loan portfolio and
adequate CAR. ROE & ROA likely to remain decent as risk of
Equitas Holdings
5,208
155
235
51.3
dilution remains low. Attractive valuations considering
growth.
Economic recovery to have favourable impact on advertising
& circulation revenue growth. Further, the acquisition of a
Jagran Prakashan
5,407
165
225
36.0
radio business (Radio City) would also boost the company's
revenue growth.
Speedier execution and speedier sales, strong revenue
Mahindra Lifespace
1,501
366
522
42.8
visibilty in short-to-long run, attractive valuations
We expect the company to report strong growth on back of
healthy growth in domestic branded sales (owing to
Mirza International
1,006
84
107
28.0
aggressive ad spend and addition in the number of EBOs &
multi-brand outlets [MBOs]) and healthy export revenues.
Massive capacity expansion along with rail advantage at
Navkar Corporation
2,484
174
265
52.1
ICD as well CFS augurs well for the company.
Strong brands and distribution network would boost growth
Siyaram Silk Mills
1,145
1,222
1,605
31.4
going ahead. Stock currently trades at an inexpensive
valuation.
Market leadership in Hindi news genre and no. 2 viewership
ranking in English news genre, exit from the radio business,
TV Today Network
1,655
277
385
38.8
and anticipated growth in ad spends by corporate to benefit
the stock.
Source: Company, Angel Research
Market Outlook
December 19, 2016
Key Upcoming Events
Global economic events release calendar
Date
Time
Country
Event Description
Unit
Period
Bloomberg Data
Last Reported Estimated
Dec 21, 2016
8:30PM
Euro Zone
Euro-Zone Consumer Confidence
Value
Dec A
(6.10)
(6.00)
8:30PM
US
Existing home sales
Million
Nov
5.60
5.50
Dec 22, 2016
7:00PM
US
GDP Qoq (Annualised)
% Change
3Q T
3.20
3.30
7:00PM
US
Initial Jobless claims
Thousands
Dec 17
254.00
258.50
Dec 23, 2016
3:00PM
UK
GDP (YoY)
% Change
3Q F
2.30
2.30
6:30AM
China
PMI Manufacturing
Value
Dec
51.70
--
Dec 27, 2016
8:30PM
US
New home sales
Thousands
Nov
563.00
575.00
Jan 1, 2017
8:30PM
US
Consumer Confidence
S.A./ 1985=100
Dec
107.10
108.75
Jan 2, 2017
2:25PM
Germany
PMI Manufacturing
Value
Dec F
55.50
55.50
Jan 3, 2017
3:00PM
UK
PMI Manufacturing
Value
Dec
53.40
53.40
2:25PM
Germany
Unemployment change (000's)
Thousands
Dec
(5.00)
(5.00)
Jan 4, 2017
2:25PM
Germany
PMI Services
Value
Dec F
53.80
53.80
Jan 6, 2017
7:00PM
US
Change in Nonfarm payrolls
Thousands
Dec
178.00
175.00
7:00PM
US
Unnemployment rate
%
Dec
4.60
4.70
Jan 8, 2017
China
Exports YoY%
% Change
Dec
0.10
--
Jan 9, 2017
China
Consumer Price Index (YoY)
% Change
Dec
2.30
--
Jan 10, 2017
India
Imports YoY%
% Change
Dec
10.40
--
3:00PM
UK
Industrial Production (YoY)
% Change
Nov
(1.10)
--
Jan 11, 2017
India
Exports YoY%
% Change
Dec
2.30
--
Jan 12, 2017
5:30PM
India
Industrial Production YoY
% Change
Nov
(1.90)
--
Jan 13, 2017
US
Producer Price Index (mom)
% Change
Dec
--
--
Jan 16, 2017
12:00PM
India
Monthly Wholesale Prices YoY%
% Change
Dec
3.15
--
Source: Bloomberg, Angel Research
Market Outlook
December 19, 2016
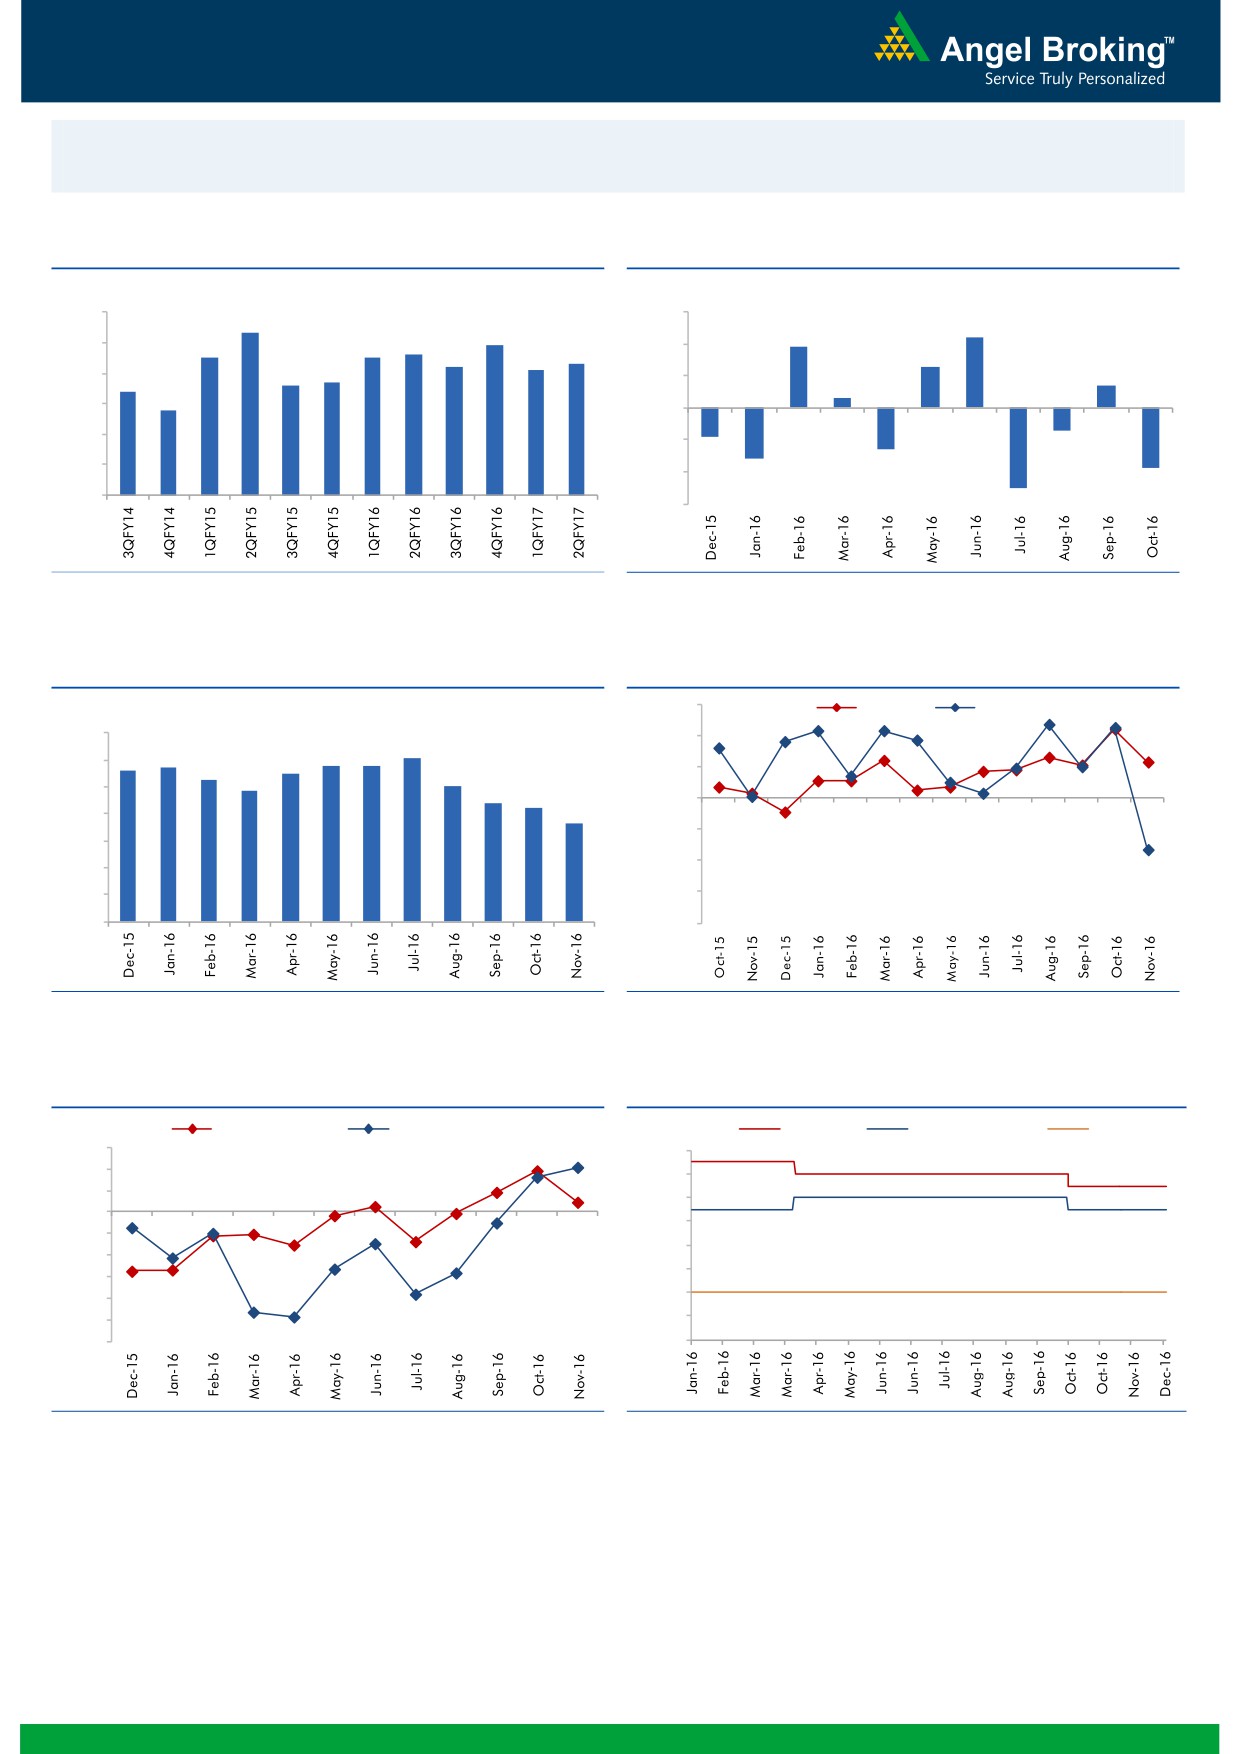
Macro watch
Exhibit 1: Quarterly GDP trends
Exhibit 2: IIP trends
(%)
(%)
9.0
3.0
8.3
2.2
7.9
1.9
7.5
7.5
7.6
8.0
7.3
2.0
7.2
7.1
1.3
6.6
6.7
0.7
7.0
6.4
1.0
0.3
5.8
6.0
-
5.0
(1.0)
(0.7)
(0.9)
4.0
(1.3)
(2.0)
(1.6)
(1.9)
3.0
(3.0)
(2.5)
Source: CSO, Angel Research
Source: MOSPI, Angel Research
Exhibit 3: Monthly CPI inflation trends
Exhibit 4: Manufacturing and services PMI
56.0
Mfg. PMI
Services PMI
(%)
7.0
54.0
6.1
5.6
5.7
5.8
5.8
6.0
5.3
5.5
5.1
52.0
4.8
5.0
4.4
4.2
50.0
3.6
4.0
48.0
3.0
46.0
2.0
1.0
44.0
-
42.0
Source: MOSPI, Angel Research
Source: Market, Angel Research; Note: Level above 50 indicates expansion
Exhibit 5: Exports and imports growth trends
Exhibit 6: Key policy rates
(%)
Exports yoy growth
Imports yoy growth
(%)
Repo rate
Reverse Repo rate
CRR
15.0
7.00
10.0
6.50
5.0
6.00
0.0
5.50
(5.0)
5.00
(10.0)
4.50
(15.0)
(20.0)
4.00
(25.0)
3.50
(30.0)
3.00
Source: Bloomberg, Angel Research
Source: RBI, Angel Research
Market Outlook
December 19, 2016
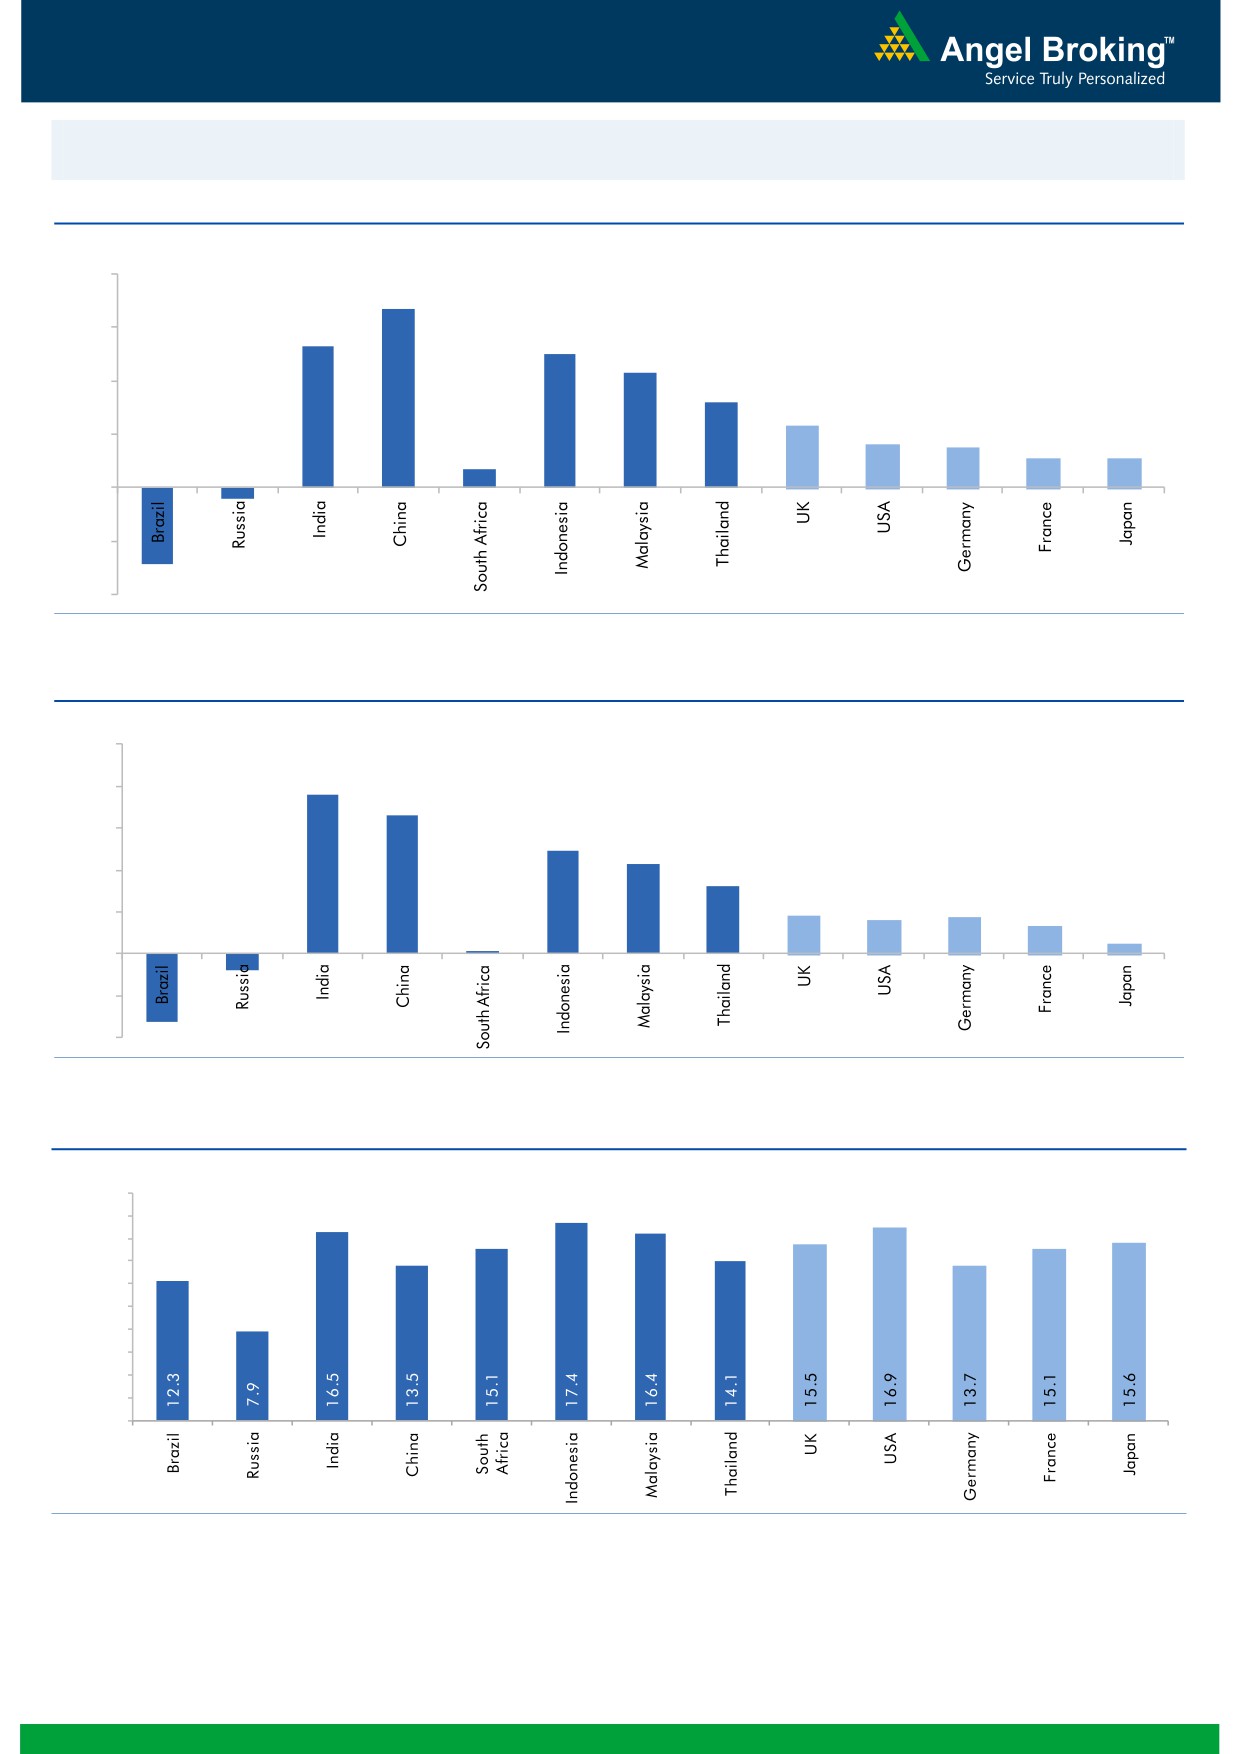
Global watch
Exhibit 1: Latest quarterly GDP Growth (%, yoy) across select developing and developed countries
(%)
8.0
6.7
5.3
6.0
5.0
0.7
4.3
4.0
3.2
2.3
1.6
1.5
2.0
1.1
1.1
-
(2.0)
(0.4)
(2.9)
(4.0)
Source: Bloomberg, Angel Research
Exhibit 2: 2016 GDP Growth projection by IMF (%, yoy) across select developing and developed countries
(%)
10.0
7.6
8.0
6.6
6.0
4.9
4.3
4.0
3.2
1.8
1.7
1.6
1.3
2.0
(0.8)
0.5
(3.3)
0.1
-
(2.0)
(4.0)
Source: IMF, Angel Research
Exhibit 3: One year forward P-E ratio across select developing and developed countries
(x)
20.0
18.0
16.0
14.0
12.0
10.0
8.0
6.0
4.0
2.0
-
Source: IMF, Angel Research
Market Outlook
December 19, 2016
Exhibit 4: Relative performance of indices across globe
Returns (%)
Country
Name of index
Closing price
1M
3M
1YR
Brazil
Bovespa
58,389
(3.9)
2.3
29.0
Russia
Micex
2,231
10.0
12.6
27.2
India
Nifty
8,139
0.3
(6.7)
5.9
China
Shanghai Composite
3,123
(2.6)
0.9
(10.0)
South Africa
Top 40
43,165
0.2
(5.0)
(1.2)
Mexico
Mexbol
45,121
(0.4)
(2.2)
3.7
Indonesia
LQ45
874
2.9
(3.7)
11.8
Malaysia
KLCI
1,638
0.4
(1.4)
(1.3)
Thailand
SET 50
947
3.5
1.7
9.9
USA
Dow Jones
19,843
4.9
9.5
15.8
UK
FTSE
7,012
3.9
2.9
16.2
Japan
Nikkei
19,401
9.8
16.4
(0.5)
Germany
DAX
11,404
6.9
11.0
8.6
France
CAC
4,833
7.4
10.0
4.7
Source: Bloomberg, Angel Research
Stock Watch
December 19, 2016
Company Name
Reco
CMP
Target
Mkt Cap
Sales ( Čcr )
OPM(%)
EPS (Č)
PER(x)
P/BV(x)
RoE(%)
EV/Sales(x)
(Č)
Price ( Č)
( Č cr )
FY17E FY18E
FY17E
FY18E
FY17E
FY18E
FY17E
FY18E
FY17E
FY18E
FY17E
FY18E
FY17E
FY18E
Agri / Agri Chemical
Rallis
Accumulate
200
209
3,895
1,937
2,164
13.3
14.3
9.0
11.0
22.3
18.2
3.9
3.4
18.4
19.8
2.0
1.8
United Phosphorus
Accumulate
663
684
33,618
15,176
17,604
18.5
18.5
37.4
44.6
17.7
14.9
3.5
2.9
21.4
21.2
2.3
1.9
Auto & Auto Ancillary
Ashok Leyland
Buy
78
111
22,112
22,407
26,022
10.6
10.6
5.2
6.4
14.9
12.1
3.4
2.8
23.6
24.7
1.1
0.9
Bajaj Auto
Neutral
2,659
-
76,940
25,093
27,891
19.5
19.2
143.9
162.5
18.5
16.4
5.2
4.5
30.3
29.4
2.8
2.5
Bharat Forge
Neutral
970
-
22,573
7,726
8,713
20.5
21.2
35.3
42.7
27.5
22.7
5.1
4.6
18.9
20.1
3.0
2.6
Eicher Motors
Neutral
21,759
-
59,193
16,583
20,447
17.5
18.0
598.0
745.2
36.4
29.2
12.4
9.5
41.2
38.3
3.4
2.7
Gabriel India
Buy
108
130
1,552
1,544
1,715
9.0
9.3
5.4
6.3
20.0
17.2
3.8
3.4
18.9
19.5
1.0
0.8
Hero Motocorp
Accumulate
3,128
3,541
62,464
30,958
34,139
15.7
15.7
193.6
208.3
16.2
15.0
6.3
5.2
34.2
30.5
1.9
1.7
Jamna Auto Industries Neutral
169
-
1,348
1,486
1,620
9.8
9.9
15.0
17.2
11.3
9.8
2.5
2.1
21.8
21.3
1.0
0.9
L G Balakrishnan & Bros Neutral
598
-
938
1,302
1,432
11.6
11.9
43.7
53.0
13.7
11.3
1.9
1.8
13.8
14.2
0.8
0.7
Mahindra and Mahindra Neutral
1,178
-
73,137
46,534
53,077
11.6
11.7
67.3
78.1
17.5
15.1
2.8
2.5
15.4
15.8
1.6
1.3
Maruti
Buy
5,184
6,006
156,591
68,057
82,958
15.8
15.5
212.1
261.2
24.4
19.9
4.8
4.0
19.8
20.3
2.0
1.5
Minda Industries
Neutral
318
-
2,523
2,728
3,042
9.0
9.1
68.2
86.2
4.7
3.7
1.1
0.8
23.8
24.3
1.0
0.9
Motherson Sumi
Neutral
323
-
45,358
45,896
53,687
7.8
8.3
13.0
16.1
24.8
20.1
8.0
6.4
34.7
35.4
1.1
0.9
Rane Brake Lining
Neutral
986
-
780
511
562
11.3
11.5
28.1
30.9
35.1
31.9
5.4
4.9
15.3
15.0
1.7
1.5
Setco Automotive
Neutral
37
-
500
741
837
13.0
13.0
15.2
17.0
2.5
2.2
0.4
0.4
15.8
16.3
1.1
1.0
Tata Motors
Neutral
473
-
136,420
300,209
338,549
8.9
8.4
42.7
54.3
11.1
8.7
1.8
1.5
15.6
17.2
0.6
0.5
TVS Motor
Neutral
377
-
17,887
13,390
15,948
6.9
7.1
12.8
16.5
29.5
22.8
7.3
5.8
26.3
27.2
1.4
1.1
Amara Raja Batteries
Buy
903
1,167
15,419
5,504
6,605
17.6
17.5
33.4
40.9
27.0
22.1
6.0
4.9
22.1
22.0
2.8
2.3
Exide Industries
Neutral
175
-
14,905
7,439
8,307
15.0
15.0
8.1
9.3
21.7
18.9
3.0
2.7
14.3
16.7
1.6
1.4
Apollo Tyres
Buy
195
235
9,903
12,877
14,504
14.3
13.9
21.4
23.0
9.1
8.5
1.4
1.2
16.4
15.2
1.0
0.9
Ceat
Accumulate
1,247
1,450
5,045
7,524
8,624
13.0
12.7
131.1
144.3
9.5
8.6
1.8
1.5
19.8
18.6
0.8
0.7
JK Tyres
Neutral
117
-
2,644
7,455
8,056
15.0
15.0
21.8
24.5
5.4
4.8
1.1
0.9
22.8
21.3
0.5
0.4
Swaraj Engines
Neutral
1,355
-
1,682
660
810
15.2
16.4
54.5
72.8
24.9
18.6
7.8
7.0
31.5
39.2
2.4
1.9
Subros
Neutral
161
-
969
1,488
1,681
11.7
11.9
6.4
7.2
25.2
22.5
2.7
2.4
10.8
11.4
0.9
0.8
Indag Rubber
Neutral
178
-
468
286
326
19.8
16.8
11.7
13.3
15.3
13.4
2.6
2.4
17.8
17.1
1.3
1.1
Capital Goods
ACE
Neutral
48
-
478
709
814
4.1
4.6
1.4
2.1
34.5
23.0
1.4
1.3
4.4
6.0
0.8
0.7
BEML
Neutral
917
-
3,818
3,451
4,055
6.3
9.2
31.4
57.9
29.2
15.8
1.8
1.6
6.3
10.9
1.2
1.0
Bharat Electronics
Neutral
1,445
-
32,275
8,137
9,169
16.8
17.2
58.7
62.5
24.6
23.1
3.8
3.4
44.6
46.3
2.9
2.6
Stock Watch
December 19, 2016
Company Name
Reco
CMP
Target
Mkt Cap
Sales ( Čcr )
OPM(%)
EPS (Č)
PER(x)
P/BV(x)
RoE(%)
EV/Sales(x)
(Č)
Price ( Č)
( Č cr )
FY17E
FY18E
FY17E
FY18E
FY17E
FY18E
FY17E
FY18E
FY17E
FY18E
FY17E
FY18E
FY17E
FY18E
Capital Goods
Voltas
Buy
319
407
10,557
6,511
7,514
7.9
8.7
12.9
16.3
24.7
19.6
4.5
3.9
16.7
18.5
1.4
1.2
BGR Energy
Neutral
115
-
832
16,567
33,848
6.0
5.6
7.8
5.9
14.8
19.6
0.8
0.8
4.7
4.2
0.2
0.1
BHEL
Neutral
123
-
30,057
28,797
34,742
-
2.8
2.3
6.9
53.4
17.8
0.9
0.9
1.3
4.8
0.7
0.5
Blue Star
Buy
472
634
4,505
4,283
5,077
5.9
7.3
14.9
22.1
31.7
21.3
6.2
5.2
20.4
26.4
1.1
0.9
Crompton Greaves
Neutral
59
-
3,710
5,777
6,120
5.9
7.0
3.3
4.5
17.9
13.2
0.8
0.8
4.4
5.9
0.6
0.5
Greaves Cotton
Neutral
123
-
2,993
1,755
1,881
16.8
16.9
7.8
8.5
15.7
14.4
3.1
2.9
20.6
20.9
1.4
1.3
Inox Wind
Neutral
203
-
4,509
5,605
6,267
15.7
16.4
24.8
30.0
8.2
6.8
2.3
1.7
25.9
24.4
0.9
0.7
KEC International
Neutral
138
-
3,552
9,294
10,186
7.9
8.1
9.9
11.9
14.0
11.6
2.0
1.8
15.6
16.3
0.6
0.6
Thermax
Neutral
824
-
9,818
5,421
5,940
7.3
7.3
25.7
30.2
32.1
27.3
3.9
3.5
12.2
13.1
1.7
1.6
VATech Wabag
Buy
470
681
2,562
3,136
3,845
8.9
9.1
26.0
35.9
18.1
13.1
2.3
1.9
13.4
15.9
0.7
0.6
Cement
ACC
Neutral
1,296
-
24,345
11,225
13,172
13.2
16.9
44.5
75.5
29.1
17.2
2.8
2.5
11.2
14.2
2.2
1.9
Ambuja Cements
Neutral
202
-
40,199
9,350
10,979
18.2
22.5
5.8
9.5
34.9
21.3
2.9
2.6
10.2
12.5
4.3
3.7
India Cements
Neutral
111
-
3,420
4,364
4,997
18.5
19.2
7.9
11.3
14.1
9.9
1.0
1.0
8.0
8.5
1.6
1.4
JK Cement
Neutral
685
-
4,788
4,398
5,173
15.5
17.5
31.2
55.5
21.9
12.3
2.6
2.3
12.0
15.5
1.7
1.4
J K Lakshmi Cement
Buy
340
565
4,004
2,913
3,412
14.5
19.5
7.5
22.5
45.4
15.1
2.8
2.4
12.5
18.0
2.0
1.7
Orient Cement
Buy
124
215
2,544
2,114
2,558
18.5
20.5
8.1
11.3
15.3
11.0
2.3
1.9
9.0
14.0
1.8
1.4
UltraTech Cement
Neutral
3,178
-
87,231
25,768
30,385
21.0
23.5
111.0
160.0
28.6
19.9
3.7
3.2
13.5
15.8
3.6
3.0
Construction
ITNL
Neutral
105
-
3,464
8,946
10,017
31.0
31.6
8.1
9.1
13.0
11.6
0.5
0.5
4.2
5.0
3.7
3.4
KNR Constructions
Buy
172
802
2,417
1,385
1,673
14.7
14.0
41.2
48.5
4.2
3.5
0.8
0.7
14.9
15.2
1.8
1.5
Larsen & Toubro
Buy
1,359
1,634
126,741
111,017
124,908
11.0
11.0
61.1
66.7
22.2
20.4
2.7
2.5
13.1
12.9
2.2
2.0
Gujarat Pipavav Port
Neutral
139
-
6,734
705
788
52.2
51.7
5.0
5.6
27.9
24.9
2.8
2.5
11.2
11.2
9.3
7.9
Nagarjuna Const.
Neutral
83
-
4,586
8,842
9,775
9.1
8.8
5.3
6.4
15.6
12.9
1.2
1.1
8.2
9.1
0.7
0.6
PNC Infratech
Buy
105
143
2,705
2,350
2,904
13.1
13.2
9.0
8.8
11.7
12.0
0.4
0.4
15.9
13.9
1.3
1.0
Simplex Infra
Neutral
279
-
1,380
6,829
7,954
10.5
10.5
31.4
37.4
8.9
7.5
0.9
0.8
9.9
13.4
0.6
0.5
Power Mech Projects
Neutral
461
-
679
1,801
2,219
12.7
14.6
72.1
113.9
6.4
4.1
1.2
1.0
16.8
11.9
0.4
0.3
Sadbhav Engineering
Accumulate
271
298
4,651
3,598
4,140
10.3
10.6
9.0
11.9
30.1
22.8
3.2
2.8
9.9
11.9
1.6
1.4
NBCC
Neutral
225
-
13,482
7,428
9,549
7.9
8.6
8.2
11.0
27.4
20.4
1.4
1.1
28.2
28.7
1.5
1.1
MEP Infra
Neutral
38
-
623
1,877
1,943
30.6
29.8
3.0
4.2
12.8
9.1
6.2
4.2
0.6
0.6
1.7
1.5
SIPL
Neutral
92
-
3,256
1,036
1,252
65.5
66.2
(8.4)
(5.6)
3.5
4.0
(22.8)
(15.9)
11.3
9.4
Stock Watch
December 19, 2016
Company Name
Reco
CMP
Target
Mkt Cap
Sales ( Čcr )
OPM(%)
EPS (Č)
PER(x)
P/BV(x)
RoE(%)
EV/Sales(x)
(Č)
Price ( Č)
( Č cr )
FY17E
FY18E
FY17E
FY18E
FY17E
FY18E
FY17E
FY18E
FY17E
FY18E
FY17E
FY18E
FY17E
FY18E
Construction
Engineers India
Neutral
306
-
10,314
1,725
1,935
16.0
19.1
11.4
13.9
26.9
22.0
3.7
3.6
13.4
15.3
4.9
4.4
Financials
Axis Bank
Buy
473
630
113,043
46,932
53,575
3.5
3.4
32.4
44.6
14.6
10.6
1.9
1.6
13.6
16.5
-
-
Bank of Baroda
Neutral
160
-
36,774
19,980
23,178
1.8
1.8
11.5
17.3
13.9
9.2
1.6
1.3
8.3
10.1
-
-
Canara Bank
Neutral
300
-
16,276
15,225
16,836
1.8
1.8
14.5
28.0
20.7
10.7
1.4
1.2
5.8
8.5
-
-
Dewan Housing Finance Buy
242
350
7,565
2,225
2,688
2.9
2.9
29.7
34.6
8.1
7.0
1.3
1.1
16.1
16.8
-
-
Equitas Holdings
Buy
155
235
5,208
939
1,281
11.7
11.5
5.8
8.2
26.8
18.9
2.3
2.1
10.9
11.5
-
-
Federal Bank
Neutral
69
-
11,804
9,353
10,623
2.9
2.9
4.4
5.8
15.6
11.8
1.5
1.3
9.5
11.0
-
-
HDFC
Neutral
1,270
-
201,029
11,475
13,450
3.4
3.4
45.3
52.5
28.0
24.2
5.4
4.8
20.2
20.5
-
-
HDFC Bank
Accumulate
1,181
1,350
301,509
46,097
55,433
4.5
4.5
58.4
68.0
20.2
17.4
3.6
3.0
18.8
18.6
-
-
ICICI Bank
Buy
256
315
148,761
42,800
44,686
3.1
3.3
18.0
21.9
14.2
11.7
1.9
1.8
11.1
12.3
-
-
Lakshmi Vilas Bank
Buy
142
174
2,549
3,339
3,799
2.7
2.8
11.0
14.0
12.9
10.2
1.3
1.2
11.2
12.7
-
-
LIC Housing Finance
Accumulate
552
630
27,842
3,712
4,293
2.6
2.5
39.0
46.0
14.2
12.0
2.7
2.3
19.9
20.1
-
-
Punjab Natl.Bank
Neutral
125
-
26,632
23,532
23,595
2.3
2.4
6.8
12.6
18.4
9.9
2.8
2.0
3.3
6.5
-
-
RBL Bank
Neutral
352
-
13,030
1,783
2,309
2.6
2.6
12.7
16.4
27.7
21.5
3.0
2.7
12.8
13.3
-
-
South Ind.Bank
Neutral
21
-
2,825
6,435
7,578
2.5
2.5
2.7
3.1
7.7
6.7
1.0
0.8
10.1
11.2
-
-
St Bk of India
Neutral
265
-
205,520
88,650
98,335
2.6
2.6
13.5
18.8
19.6
14.1
1.9
1.6
7.0
8.5
-
-
Union Bank
Neutral
137
-
9,408
13,450
14,925
2.3
2.3
25.5
34.5
5.4
4.0
0.8
0.7
7.5
10.2
-
-
Yes Bank
Neutral
1,181
-
49,939
8,978
11,281
3.3
3.4
74.0
90.0
16.0
13.1
3.0
2.6
17.0
17.2
-
-
FMCG
Asian Paints
Neutral
901
-
86,414
17,128
18,978
16.8
16.4
19.1
20.7
47.2
43.5
16.4
15.5
34.8
35.5
5.0
4.5
Britannia
Buy
2,894
3,626
34,724
9,594
11,011
14.6
14.9
80.3
94.0
36.0
30.8
14.8
11.4
41.2
-
3.5
3.0
Colgate
Accumulate
911
995
24,779
4,605
5,149
23.4
23.4
23.8
26.9
38.3
33.9
21.2
16.6
64.8
66.8
5.3
4.7
Dabur India
Accumulate
271
304
47,772
8,315
9,405
19.8
20.7
8.1
9.2
33.5
29.5
9.3
7.7
31.6
31.0
5.4
4.8
GlaxoSmith Con*
Neutral
5,100
-
21,447
4,350
4,823
21.2
21.4
179.2
196.5
28.5
26.0
7.6
6.4
27.1
26.8
4.3
3.8
Godrej Consumer
Neutral
1,478
-
50,344
10,235
11,428
18.4
18.6
41.1
44.2
36.0
33.4
8.0
6.7
24.9
24.8
4.9
4.3
HUL
Neutral
817
-
176,886
35,252
38,495
17.8
17.8
20.7
22.4
39.6
36.5
37.8
32.5
95.6
88.9
4.9
4.4
ITC
Buy
227
284
274,565
40,059
44,439
38.3
39.2
9.0
10.1
25.2
22.4
7.0
6.2
27.8
27.5
6.5
5.8
Marico
Buy
251
300
32,379
6,430
7,349
18.8
19.5
6.4
7.7
39.2
32.6
11.8
10.0
33.2
32.5
4.9
4.2
Nestle*
Neutral
6,079
-
58,612
10,073
11,807
20.7
21.5
124.8
154.2
48.7
39.4
20.0
18.0
34.8
36.7
5.7
4.9
Tata Global
Neutral
124
-
7,845
8,675
9,088
9.8
9.8
7.4
8.2
16.8
15.2
1.9
1.8
7.9
8.1
0.8
0.8
Stock Watch
December 19, 2016
Company Name
Reco
CMP
Target
Mkt Cap
Sales ( Čcr )
OPM(%)
EPS (Č)
PER(x)
P/BV(x)
RoE(%)
EV/Sales(x)
(Č)
Price ( Č)
( Č cr )
FY17E FY18E
FY17E
FY18E
FY17E
FY18E
FY17E
FY18E
FY17E
FY18E
FY17E
FY18E
FY17E
FY18E
FMCG
Procter & Gamble
Accumulate
6,837
7,369
22,193
2,939
3,342
23.2
23.0
146.2
163.7
46.8
41.8
104.7
100.4
25.3
23.5
7.3
6.3
Hygiene
IT
HCL Tech^
Buy
821
1,000
115,790
49,242
57,168
20.5
20.5
55.7
64.1
14.7
12.8
3.0
2.3
20.3
17.9
2.2
1.8
Infosys
Buy
1,004
1,249
230,659
68,350
77,326
27.0
27.0
62.5
69.4
16.1
14.5
3.4
3.1
21.3
21.6
2.8
2.4
TCS
Buy
2,282
2,620
449,602
119,025
133,308
27.6
27.6
131.2
145.5
17.4
15.7
5.6
5.2
32.4
33.1
3.5
3.1
Tech Mahindra
Buy
477
600
46,425
29,673
32,937
15.5
17.0
32.8
39.9
14.6
12.0
2.9
2.5
19.6
20.7
1.3
1.1
Wipro
Buy
464
590
112,719
55,440
60,430
18.1
18.1
35.9
39.9
12.9
11.6
2.3
2.1
19.0
19.3
1.8
1.6
Media
D B Corp
Neutral
354
-
6,517
2,297
2,590
27.4
28.2
21.0
23.4
16.9
15.2
3.9
3.4
23.7
23.1
2.6
2.3
HT Media
Neutral
73
-
1,692
2,693
2,991
12.6
12.9
7.9
9.0
9.2
8.1
0.8
0.7
7.8
8.3
0.2
0.1
Jagran Prakashan
Buy
165
225
5,407
2,355
2,635
28.0
28.0
10.8
12.5
15.3
13.2
3.3
2.9
21.7
21.7
2.3
2.0
Sun TV Network
Neutral
494
-
19,462
2,850
3,265
70.1
71.0
26.2
30.4
18.9
16.3
4.8
4.3
24.3
25.6
6.5
5.5
Hindustan Media
Neutral
272
-
1,993
1,016
1,138
24.3
25.2
27.3
30.1
10.0
9.0
1.9
1.7
16.2
15.8
1.2
1.1
Ventures
TV Today Network
Buy
277
385
1,655
637
743
27.5
27.5
18.4
21.4
15.1
13.0
2.6
2.2
17.4
17.2
2.2
1.8
Metals & Mining
Coal India
Neutral
288
-
178,898
84,638
94,297
21.4
22.3
24.5
27.1
11.8
10.6
4.9
4.7
42.6
46.0
1.6
1.5
Hind. Zinc
Neutral
281
-
118,584
14,252
18,465
55.9
48.3
15.8
21.5
17.8
13.1
2.9
2.5
17.0
20.7
8.5
6.5
Hindalco
Neutral
170
-
35,163
107,899
112,095
7.4
8.2
9.2
13.0
18.5
13.1
0.9
0.8
4.8
6.6
0.9
0.8
JSW Steel
Neutral
1,618
-
39,117
53,201
58,779
16.1
16.2
130.6
153.7
12.4
10.5
1.7
1.5
14.0
14.4
1.5
1.3
NMDC
Neutral
128
-
40,340
6,643
7,284
44.4
47.7
7.1
7.7
18.0
16.6
1.6
1.5
8.8
9.2
4.0
3.6
SAIL
Neutral
52
-
21,600
47,528
53,738
(0.7)
2.1
(1.9)
2.6
20.1
0.6
0.5
(1.6)
3.9
1.3
1.2
Vedanta
Neutral
230
-
68,277
71,744
81,944
19.2
21.7
13.4
20.1
17.2
11.5
1.5
1.3
8.4
11.3
1.4
1.1
Tata Steel
Neutral
414
-
40,218
121,374
121,856
7.2
8.4
18.6
34.3
22.3
12.1
1.4
1.3
6.1
10.1
1.0
1.0
Oil & Gas
Cairn India
Neutral
256
-
48,059
9,127
10,632
4.3
20.6
8.8
11.7
29.1
21.9
0.9
0.9
3.3
4.2
6.8
5.7
GAIL
Neutral
415
-
52,654
56,220
65,198
9.3
10.1
27.1
33.3
15.3
12.5
1.4
1.3
9.3
10.7
1.1
1.0
ONGC
Neutral
202
-
258,846
137,222
152,563
15.0
21.8
19.5
24.1
10.3
8.4
0.9
0.8
8.5
10.1
2.2
2.0
Indian Oil Corp
Neutral
296
-
143,905
373,359
428,656
5.9
5.5
54.0
59.3
5.5
5.0
0.9
0.8
16.0
15.6
0.5
0.5
Reliance Industries
Neutral
1,058
-
343,026
301,963
358,039
12.1
12.6
87.7
101.7
12.1
10.4
1.2
1.1
10.7
11.3
1.6
1.3
Pharmaceuticals
Alembic Pharma
Neutral
623
-
11,744
3,483
4,083
20.2
21.4
24.3
30.4
25.6
20.5
5.8
4.7
25.5
25.3
3.3
2.7
Alkem Laboratories Ltd
Buy
1,602
1,989
19,154
6,043
6,893
18.7
19.3
80.5
88.8
19.9
18.0
4.4
3.7
22.3
20.3
3.2
2.7
Aurobindo Pharma
Buy
691
877
40,438
15,720
18,078
23.7
23.7
41.4
47.3
16.7
14.6
4.3
3.4
29.6
26.1
2.8
2.4
Sanofi India*
Neutral
4,291
-
9,881
2,277
2,597
17.3
18.3
149.4
172.0
28.7
24.9
4.8
3.8
25.1
28.8
4.0
3.3
Stock Watch
December 19, 2016
Company Name
Reco
CMP
Target
Mkt Cap
Sales ( Čcr )
OPM(%)
EPS (Č)
PER(x)
P/BV(x)
RoE(%)
EV/Sales(x)
(Č)
Price ( Č)
( Č cr )
FY17E FY18E
FY17E
FY18E
FY17E
FY18E
FY17E
FY18E
FY17E
FY18E
FY17E
FY18E
FY17E
FY18E
Pharmaceuticals
Cadila Healthcare
Neutral
376
-
38,498
10,429
12,318
22.6
22.0
16.9
19.2
22.3
19.6
5.7
4.6
28.5
25.7
3.7
3.1
Cipla
Reduce
566
490
45,522
15,378
18,089
17.4
18.4
21.6
27.2
26.2
20.8
3.4
3.0
13.7
15.2
3.1
2.6
Dr Reddy's
Neutral
3,107
-
51,472
16,043
18,119
20.8
22.4
112.4
142.9
27.7
21.8
3.7
3.2
14.1
15.9
3.2
2.8
Dishman Pharma
Neutral
219
-
3,530
1,718
1,890
22.7
22.8
9.5
11.3
23.0
19.4
2.2
2.0
10.1
10.9
2.5
2.2
GSK Pharma*
Neutral
2,722
-
23,060
3,000
3,312
15.4
20.6
46.5
60.8
58.6
44.8
14.1
14.0
26.3
30.6
7.4
6.8
Indoco Remedies
Reduce
263
240
2,420
1,112
1,289
16.2
18.2
11.6
16.0
22.6
16.4
3.6
3.0
17.0
20.1
2.3
1.9
Ipca labs
Accumulate
546
613
6,891
3,303
3,799
15.3
15.3
17.3
19.7
31.6
27.7
2.8
2.5
9.1
9.4
2.2
1.9
Lupin
Buy
1,469
1,809
66,281
15,912
18,644
26.4
26.7
58.1
69.3
25.3
21.2
4.9
4.0
21.4
20.9
4.3
3.5
Sun Pharma
Buy
647
847
155,253
31,129
35,258
32.0
32.9
30.2
35.3
21.4
18.3
3.5
2.9
20.0
20.1
4.6
3.8
Power
Tata Power
Neutral
77
-
20,717
36,916
39,557
17.4
27.1
5.1
6.3
15.0
12.2
1.3
1.2
9.0
10.3
1.6
1.4
NTPC
Neutral
160
-
131,886
86,605
95,545
17.5
20.8
11.8
13.4
13.6
11.9
1.4
1.3
10.5
11.1
2.9
2.9
Power Grid
Buy
184
223
96,340
25,315
29,193
88.2
88.7
14.2
17.2
13.0
10.7
2.0
1.7
15.2
16.1
8.4
7.6
Real Estate
MLIFE
Buy
366
522
1,501
1,152
1,300
22.7
24.6
29.9
35.8
12.2
10.2
0.9
0.9
7.6
8.6
2.0
1.7
Telecom
Bharti Airtel
Neutral
310
-
123,899
105,086
114,808
34.5
34.7
12.2
16.4
25.4
18.9
1.7
1.6
6.8
8.4
2.1
1.8
Idea Cellular
Neutral
76
-
27,442
40,133
43,731
37.2
37.1
6.4
6.5
11.9
11.7
1.0
0.9
8.2
7.6
1.7
1.5
zOthers
Abbott India
Neutral
4,656
-
9,894
3,153
3,583
14.1
14.4
152.2
182.7
30.6
25.5
150.2
128.3
25.6
26.1
2.9
2.5
Bajaj Electricals
Buy
219
274
2,213
4,801
5,351
5.7
6.2
10.4
13.7
21.0
16.0
2.6
2.3
12.4
14.5
0.5
0.4
Finolex Cables
Neutral
411
-
6,279
2,883
3,115
12.0
12.1
14.2
18.6
28.9
22.1
15.4
13.4
15.8
14.6
1.9
1.8
Goodyear India*
Neutral
714
-
1,648
1,598
1,704
10.4
10.2
49.4
52.6
14.5
13.6
66.8
58.6
18.2
17.0
0.7
98.7
Hitachi
Neutral
1,461
-
3,972
2,081
2,433
8.8
8.9
33.4
39.9
43.7
36.6
35.3
29.4
22.1
21.4
1.9
1.6
Jyothy Laboratories
Neutral
362
-
6,577
1,440
2,052
11.5
13.0
8.5
10.0
42.6
36.2
10.3
9.6
18.6
19.3
4.8
3.3
Page Industries
Neutral
13,945
-
15,554
2,450
3,124
20.1
17.6
299.0
310.0
46.6
45.0
310.6
237.1
47.1
87.5
6.3
5.0
Relaxo Footwears
Neutral
401
-
4,812
2,085
2,469
9.2
8.2
7.6
8.0
53.0
50.4
20.5
17.5
17.9
18.8
2.4
2.0
Siyaram Silk Mills
Accumulate
1,222
1,605
1,145
1,733
1,948
11.6
11.7
96.6
114.7
12.6
10.7
1.9
1.7
15.3
15.7
0.9
0.8
Styrolution ABS India*
Neutral
590
-
1,037
1,440
1,537
9.2
9.0
40.6
42.6
14.5
13.8
37.1
33.7
12.3
11.6
0.7
0.6
TVS Srichakra
Neutral
3,208
-
2,456
2,304
2,614
13.7
13.8
231.1
266.6
13.9
12.0
360.4
283.8
33.9
29.3
1.1
0.9
HSIL
Neutral
279
-
2,015
2,384
2,515
15.8
16.3
15.3
19.4
18.2
14.4
18.1
15.6
7.8
9.3
1.0
0.9
Kirloskar Engines India
Neutral
326
-
4,707
2,554
2,800
9.9
10.0
10.5
12.1
31.0
26.9
13.0
12.2
10.7
11.7
1.5
1.3
Ltd
M M Forgings
Neutral
448
-
541
546
608
20.4
20.7
41.3
48.7
10.9
9.2
61.4
54.3
16.6
17.0
0.8
0.7
Stock Watch
December 19, 2016
Company Name
Reco
CMP
Target
Mkt Cap
Sales ( Čcr )
OPM(%)
EPS (Č)
PER(x)
P/BV(x)
RoE(%)
EV/Sales(x)
(Č)
Price ( Č)
( Č cr )
FY17E
FY18E
FY17E
FY18E
FY17E
FY18E
FY17E
FY18E
FY17E
FY18E
FY17E
FY18E
FY17E
FY18E
zOthers
Banco Products (India) Neutral
188
-
1,341
1,353
1,471
12.3
12.4
14.5
16.3
12.9
11.5
17.9
16.1
14.5
14.6
0.9
101.7
Competent Automobiles Neutral
167
-
103
1,137
1,256
3.1
2.7
28.0
23.6
6.0
7.1
32.1
29.0
14.3
11.5
0.1
0.1
Nilkamal
Neutral
1,320
-
1,970
1,995
2,165
10.7
10.4
69.8
80.6
18.9
16.4
75.4
65.5
16.6
16.5
1.0
0.9
Visaka Industries
Neutral
186
-
295
1,051
1,138
10.3
10.4
21.0
23.1
8.9
8.0
23.8
22.3
9.0
9.2
0.5
0.5
Transport Corporation of
Neutral
164
-
1,255
2,671
2,911
8.5
8.8
13.9
15.7
11.8
10.5
1.6
1.4
13.7
13.8
0.6
0.5
India
Elecon Engineering
Neutral
60
-
675
1,482
1,660
13.7
14.5
3.9
5.8
15.4
10.4
3.6
3.3
7.8
10.9
0.8
0.7
Surya Roshni
Neutral
187
-
818
3,342
3,625
7.8
7.5
17.3
19.8
10.8
9.4
20.5
16.5
10.5
10.8
0.5
0.4
MT Educare
Neutral
120
-
479
366
417
17.7
18.2
9.4
10.8
12.8
11.1
2.9
2.5
22.2
22.3
1.2
1.1
Radico Khaitan
Buy
114
147
1,513
1,667
1,824
13.0
13.2
6.7
8.2
17.1
13.9
1.6
1.4
9.0
10.2
1.3
1.2
Garware Wall Ropes
Neutral
630
-
1,378
873
938
14.3
14.3
35.2
37.5
17.9
16.8
3.1
2.7
17.5
15.9
1.5
1.4
Wonderla Holidays
Neutral
355
-
2,007
287
355
38.0
40.0
11.3
14.2
31.4
25.0
4.5
3.9
21.4
23.9
6.5
5.3
Linc Pen & Plastics
Neutral
231
-
342
382
420
9.3
9.5
13.5
15.7
17.2
14.7
2.9
2.5
17.1
17.3
1.0
0.9
The Byke Hospitality
Neutral
167
-
671
287
384
20.5
20.5
7.6
10.7
22.0
15.6
4.6
3.7
20.7
23.5
2.4
1.7
Interglobe Aviation
Neutral
830
-
30,013
21,122
26,005
14.5
27.6
110.7
132.1
7.5
6.3
44.9
32.1
168.5
201.1
1.4
1.1
Coffee Day Enterprises
Neutral
200
-
4,117
2,964
3,260
20.5
21.2
4.7
8.0
-
25.0
2.3
2.1
5.5
8.5
1.8
1.6
Ltd
Navneet Education
Neutral
109
-
2,604
1,062
1,147
24.0
24.0
6.1
6.6
17.9
16.5
3.7
3.3
20.6
19.8
2.5
2.3
Navkar Corporation
Buy
174
265
2,484
369
561
42.9
42.3
7.2
11.5
24.1
15.1
1.8
1.6
7.4
10.5
7.7
5.1
UFO Moviez
Neutral
415
-
1,145
619
685
33.2
33.4
30.0
34.9
13.8
11.9
1.9
1.7
13.8
13.9
1.6
1.2
VRL Logistics
Neutral
266
-
2,431
1,902
2,119
16.7
16.6
14.6
16.8
18.3
15.8
4.0
3.5
21.9
22.2
1.4
1.2
Team Lease Serv.
Neutral
890
-
1,522
3,229
4,001
1.5
1.8
22.8
32.8
39.1
27.1
4.2
3.6
10.7
13.4
0.4
0.3
S H Kelkar & Co.
Neutral
285
-
4,128
1,036
1,160
15.1
15.0
6.1
7.2
46.8
39.8
5.0
4.6
10.7
11.5
3.9
3.5
Quick Heal
Neutral
273
-
1,914
408
495
27.3
27.0
7.7
8.8
35.3
31.1
3.3
3.3
9.3
10.6
3.9
3.2
Narayana Hrudaya
Neutral
338
-
6,907
1,873
2,166
11.5
11.7
2.6
4.0
127.8
85.3
7.8
7.1
6.1
8.3
3.8
3.3
Manpasand Bever.
Neutral
565
-
3,234
836
1,087
19.6
19.4
16.9
23.8
33.5
23.7
4.0
3.5
12.0
14.8
3.6
2.7
Parag Milk Foods
Neutral
265
-
2,226
1,919
2,231
9.3
9.6
9.5
12.9
28.0
20.5
4.4
3.6
15.5
17.5
1.3
1.1
Mirza International
Buy
84
107
1,006
987
1,106
18.0
18.0
6.5
7.6
12.8
11.0
2.1
1.8
15.9
15.7
1.2
1.1
Asian Granito
Buy
218
351
654
1,071
1,182
12.1
12.4
12.7
16.0
17.1
13.6
1.6
1.5
9.5
10.7
0.9
0.8
Source: Company, Angel Research; Note: *December year end; #September year end; &October year end; Price as on December 17, 2016
Market Outlook
December 19, 2016
Research Team Tel: 022 - 39357800
DISCLAIMER
Angel Broking Private Limited (hereinafter referred to as “Angel”) is a registered Member of National Stock Exchange of India
Limited,Bombay Stock Exchange Limited and Metropolitan Stock Exchange Limited. It is also registered as a Depository Participant with
CDSL and Portfolio Manager with SEBI. It also has registration with AMFI as a Mutual Fund Distributor. Angel Broking Private Limited is a
registered entity with SEBI for Research Analyst in terms of SEBI (Research Analyst) Regulations, 2014 vide registration number
INH000000164. Angel or its associates has not been debarred/ suspended by SEBI or any other regulatory authority for accessing
/dealing in securities Market. Angel or its associates/analyst has not received any compensation / managed or
co-managed public offering of securities of the company covered by Analyst during the past twelve months.
This document is solely for the personal information of the recipient, and must not be singularly used as the basis of any investment
decision. Nothing in this document should be construed as investment or financial advice. Each recipient of this document should make
such investigations as they deem necessary to arrive at an independent evaluation of an investment in the securities of the companies
referred to in this document (including the merits and risks involved), and should consult their own advisors to determine the merits and
risks of such an investment.
Reports based on technical and derivative analysis center on studying charts of a stock's price movement, outstanding positions and
trading volume, as opposed to focusing on a company's fundamentals and, as such, may not match with a report on a company's
fundamentals. Investors are advised to refer the Fundamental and Technical Research Reports available on our website to evaluate the
contrary view, if any.
The information in this document has been printed on the basis of publicly available information, internal data and other reliable
sources believed to be true, but we do not represent that it is accurate or complete and it should not be relied on as such, as this
document is for general guidance only. Angel Broking Pvt. Limited or any of its affiliates/ group companies shall not be in any way
responsible for any loss or damage that may arise to any person from any inadvertent error in the information contained in this report.
Angel Broking Pvt. Limited has not independently verified all the information contained within this document. Accordingly, we cannot
testify, nor make any representation or warranty, express or implied, to the accuracy, contents or data contained within this document.
While Angel Broking Pvt. Limited endeavors to update on a reasonable basis the information discussed in this material, there may be
regulatory, compliance, or other reasons that prevent us from doing so.
This document is being supplied to you solely for your information, and its contents, information or data may not be reproduced,
redistributed or passed on, directly or indirectly.
Neither Angel Broking Pvt. Limited, nor its directors, employees or affiliates shall be liable for any loss or damage that may arise from
or in connection with the use of this information.